A Closer Look at Fitbit Data
Sat May 04 2019
Health trackers are the current craze. After I bought a Fitbit, I wanted to determine what exactly could I do with my Fitbit data. Can we learn something from this data that we did not know before? Most people don’t need a watch to tell them that they walked a lot today or that they got a ton of sleep. We typically have a pretty good gauge of our basic physical health. I am interested in figuring out how we can use data science to look at our health over a longer period of time and learn something.
Lets first look at a few things that people typically use Fitbit data for before we jump into the weeds.
- Setting Goals
- Motivation
- Tracking Progress
Ever since I bought a Fitbit, I found that I went to the gym a lot more frequently. Having something which keeps track of your progress is a great motivator. Not only is your daily steps recorded for your own viewing, you can share that data with your friends as a competition. Although I only have one friend on Fitbit, I found that was a good motivator to hit ten thousand steps every day.
Goals which are not concrete never get accomplished. Simply saying that “I will get in shape” is a terrible goal. In order for you to actually accomplish your goals, they need to be quantifiable, reasonable, and measurable. Rather than saying “I will improve my health this year”, you can say “I will loose ten pounds this year by increasing my daily step count to twelve thousand and go to the gym twice a week”. One goal is wishy washy where the other is concrete and measurable. Having concrete data from Fitbit allows you to quantify your goals and set milestones for you to accomplish. Along the way to achieving your goal, you can easily track your progress.
Simply knowing your Fitbit data can help you make more informed decisions about your fitness. You can tweak your life style after comparing your data against what is considered healthy. For example: if you notice that you are only getting 6 hours of sleep per night, you can look up the recommended amount of sleep and tweak your sleep routine until you hit that target.
Alright, lets do some data science!

1 Getting The Data
There are two options that we can use to fetch data from Fitbit.
1.1 Using Fitbit’s API
Fitbit has an OAuth 2.0 web API that you can use. You have to register your application on Fitbit’s website to receive a client ID and a client secret to connect to the API.
I decided to fetch the Fitbit data using an Express app with node. Fetching the data this way will make it really easy to use on a live website. Node has tons of NPM modules which makes connecting to Fitbit’s API relatively easy. I’m using Passport which is a common authentication middleware for Express.
/** express app */
const express = require("express");

/** Manages oauth 2.0 w/ fitbit */
const passport = require('passport');

/** Used to make API calls */
const unirest = require('unirest');

/** express app */
const app = express();

app.use(passport.initialize());
app.use(passport.session({
    resave: false,
    saveUninitialized: true
}));


var FitbitStrategy = require( 'passport-fitbit-oauth2' ).FitbitOAuth2Strategy;


var accessTokenTemp = null;
passport.use(new FitbitStrategy({
        clientID:     config.clientID,
        clientSecret: config.clientSecret,
        callbackURL: config.callbackURL
    },
    function(accessToken, refreshToken, profile, done)
    {
        console.log(accessToken);
        accessTokenTemp = accessToken;
        done(null, {
            accessToken: accessToken,
            refreshToken: refreshToken,
            profile: profile
        });
    }
));

passport.serializeUser(function(user, done) {
    done(null, user);
});

passport.deserializeUser(function(obj, done) {
    done(null, obj);
});

passport.authenticate('fitbit', { scope:
    ['activity','heartrate','location','profile']
});
Since our authentication middlware is all set up, we just need to add the express routes which are required when authenticating.
app.get('/auth/fitbit',
    passport.authenticate('fitbit', { scope:
    ['activity','heartrate','location','profile'] }
));

app.get( '/auth/fitbit/callback', passport.authenticate( 'fitbit', {
    successRedirect: '/',
    failureRedirect: '/error'
}));


app.get('/error', (request, result) =>
{
    result.write("Error authenticating with Fitbit API");
    result.end();
});
Now that we are authenticated with Fitbit, we can finally make queries to Fitbit’s Server. I created a helper function called “queryAPI” which attempts to authenticate if it is not already authenticated and then fetches the API result from a provided URL.
const queryAPI = function(result, path)
{
    return new Promise((resolve, reject)=>
    {
        if(accessTokenTemp == null)
        {
            result.redirect('/auth/fitbit');
            resolve(false);
        }

        unirest.get(path)
            .headers({'Accept': 'application/json', 'Content-Type': 'application/json',
                Authorization: "Bearer " +  accessTokenTemp})
            .end(function (response)
            {
                if(response.hasOwnProperty("success") && response.success == false)
                {
                    result.redirect('/auth/fitbit');
                    resolve(false);
                }
                resolve(response.body);
            });
    });
};

app.get('/steps', (request, result)=>
{
    queryAPI(result, 'https://api.fitbit.com/1/user/-/activities/tracker/steps/date/today/1m.json').then((data)=>
    {
        if(data != false)
        {
            result.writeHead(200, {'Content-Type': 'text/html'});
            result.write(JSON.stringify(data));
            result.end();
        }
        else
        {
            console.log("Validating with API");
        }
    });
});
1.2 Exporting Data from Website
On Fitbit’s website there is a nice page where you can export your data.
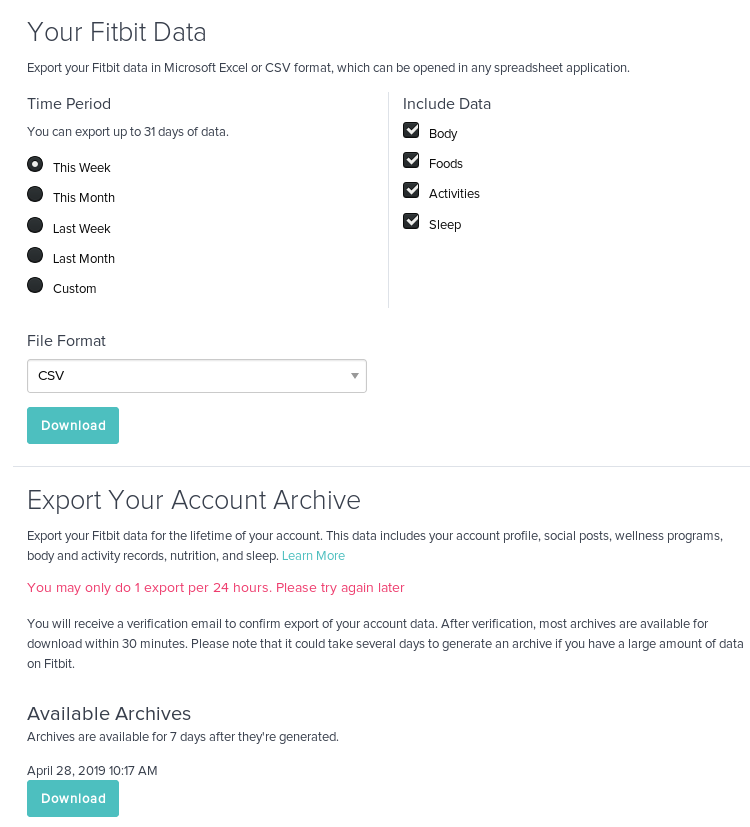
The on demand export is pretty useless because it can only go back a month. On top of that, you don’t get to download any detailed heart rate data. The data that you get is aggregated by day. This might be fine for some use cases; however, this will not suffice for any interesting analysis.
I decided to try the account archive option out of curiosity.
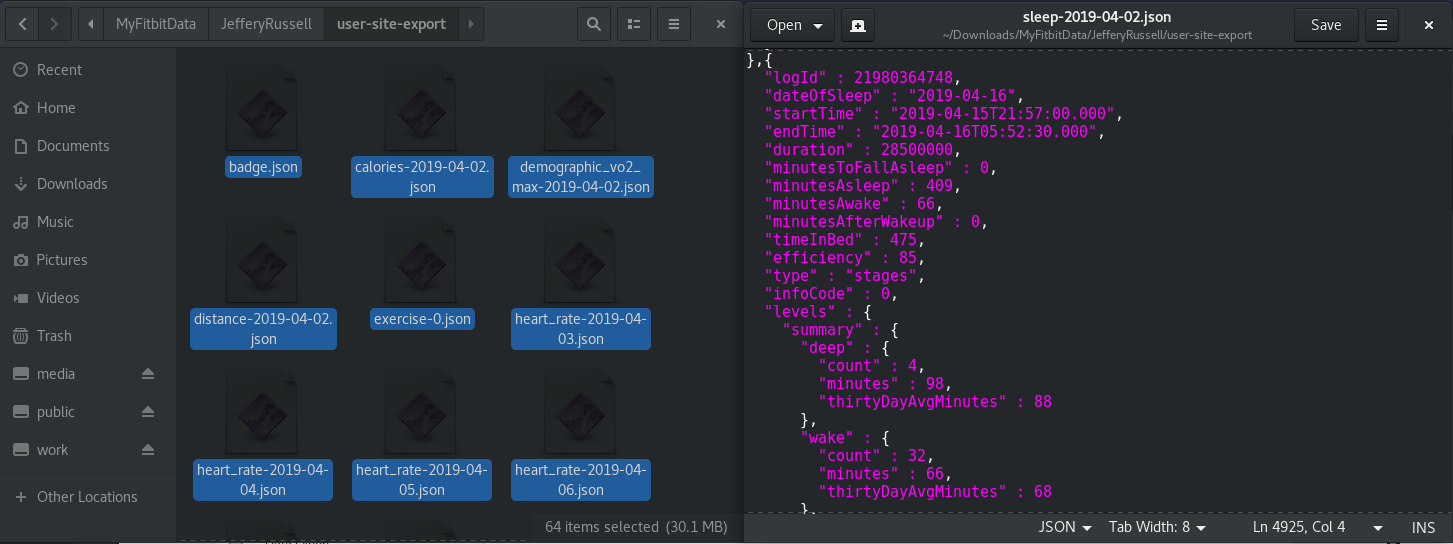
The Fitbit data archive was very organized and kept meticulous records of everything. All of the data was organized in separate JSON files labeled by date. Fitbit keeps around 1MB of data on you per day; most of this data is from the heart rate sensors. Although 1MB of data may sound like a ton of data, it is probably a lot less if you store it in formats other than JSON. Since Fitbit hires a lot of people for hadoop and SQL development, they are most likely using Apache Hive to store user information on the backend. Distributing the data to users as JSON is really convenient since it makes learning the data schema very easy.
2 Visualizing The Data
Since the Data Archive is far easier, I’m going to start visualizing the data retrieved from the JSON archive. In the future I may use the Fitbit API if I decide to make this a live website. Using R to visualize this would be convenient, however; I want to use some pretty javascript graphs so I can host this as a demo on my website.
2.1 Heart Rate
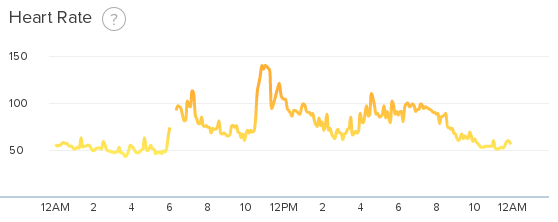
My biggest complaint with Fitbit’s website is that they only display your continuous heart rate in one day intervals. If you zoom out to the week or month view, it aggregates it as the number of minutes you are in each heart rate zone. This is fine for the fitbit app where you have limited screen space and no good ways of zooming in and out of the graphs.

I really want to be able to view my heart rate over the course of a few days. To visualize the continuous heart rate I’m going to use VisJS because it works really well with time series data.
To start, I wrote some Javascript which reads the local JSON files from the Fitbit data export.
<div class="col-4 shadow-lg p-3 bg-white rounded">
    <label>Heart Rate JSON Files</label>
    <input type="file" id="files" name="files[]" multiple />
    <output id="list"></output>
</div>
...
<script>
    function handleFileSelect(evt)
    {
        fetchFilesAsJSONArray(evt).then((data)=>
        {
            generateHeartRateGraph(data);
        })
    }
    document.getElementById('files').addEventListener('change', handleFileSelect, false);

    function fetchFilesAsJSONArray(evt)
    {
        return new Promise((res, rej)=>
        {
            var files = evt.target.files; // FileList object

            var promises = [];

            for (var i = 0, f; f = files[i]; i++)
            {
                promises.push(new Promise((resolve, reject)=>
                {
                    var reader = new FileReader();

                    reader.onload = function(e)
                    {
                        resolve(JSON.parse(reader.result));
                    };

                    reader.onerror= function(e)
                    {
                        reject(e);
                    };
                    reader.readAsBinaryString(files[i]);
                }));
            }
            Promise.all(promises).then((data)=>
            {
                res(data);
            }).catch((error)=>
            {
                console.log(error);
                console.log("Unable to Load Data");
                rej(error);
            })
        });
    }
</script>
The heart rate JSON files look like this:
[{
  "dateTime" : "04/22/19 04:00:05",
  "value" : {
    "bpm" : 69,
    "confidence" : 2
  }
},{
  "dateTime" : "04/22/19 04:00:10",
  "value" : {
    "bpm" : 70,
    "confidence" : 2
  }
}
...
]
I found it interesting that each point had a confidence value associated with it. I wonder how Fitbit is using that confidence information. Since it does not directly appear anywhere in the app, Fitbit may just be using it to exclude inaccurate points from the heart rate graphs and calculations. A really annoying thing about this data is that the time stamps don’t contain any information on the timezone. When graphing this data, I shifted the times by 4 hours so that it aligns with eastern standard time.
After we read the data from the user selected heart rate files, we can treat that object as an array of arrays. Each array represents a file containing an entire days worth of heart rate measurements. Each day is an array of time stamped points with heart rate information. Using the code from the VisJS examples, it is relatively straightforward to plot this data.
function generateHeartRateGraph(jsonFiles)
{
var items = [];
for(var i = 0; i < jsonFiles.length; i++)
{
console.log(jsonFiles[i].length);
for(var j = 0; j < jsonFiles[i].length; j++)
{
var localTime = new Date(jsonFiles[i][j].dateTime);
items.push({y:jsonFiles[i][j].value.bpm,
x:localTime.setHours(localTime.getHours() - 4)});
}
}
var dataset = new vis.DataSet(items);
var options = {
dataAxis: {
showMinorLabels: true,
left: {
title: {
text: "Heart Rate"
}
}
}
};
var container = document.getElementById("heartRateGraph");
var graph2d = new vis.Graph2d(container, dataset, options);
graph2d.on('rangechanged', graphMoved);
graphsOnPage.push(graph2d);
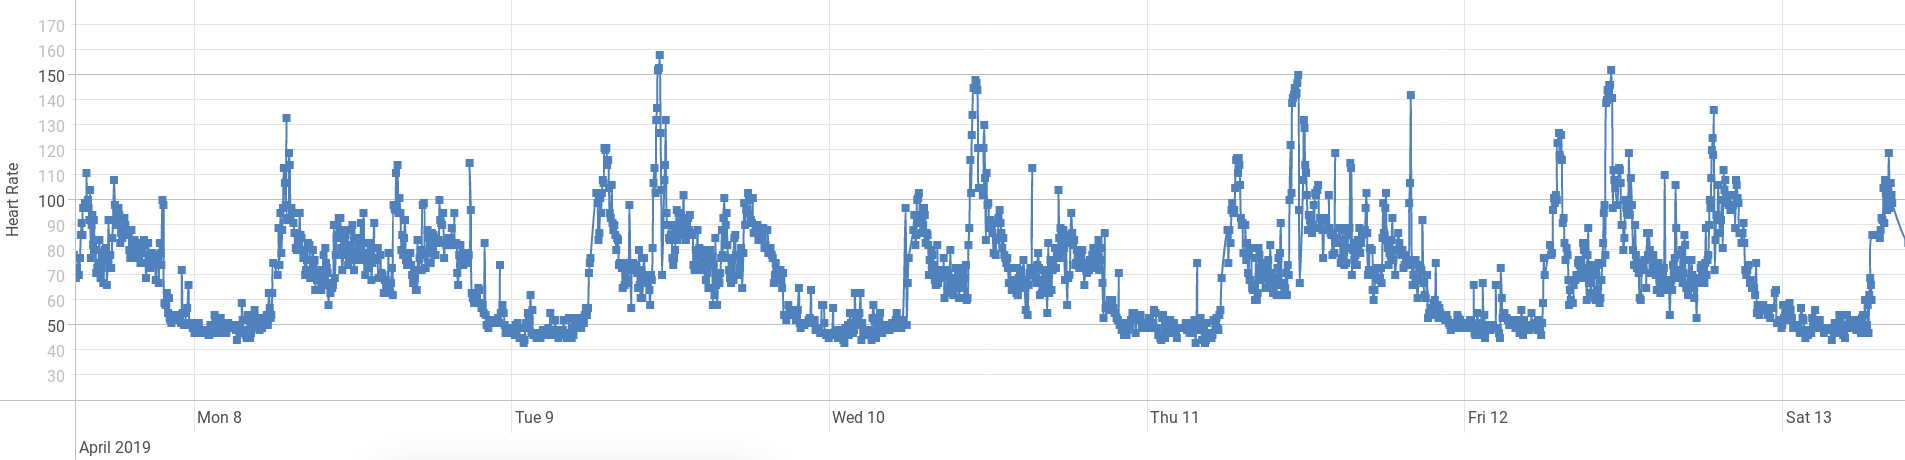
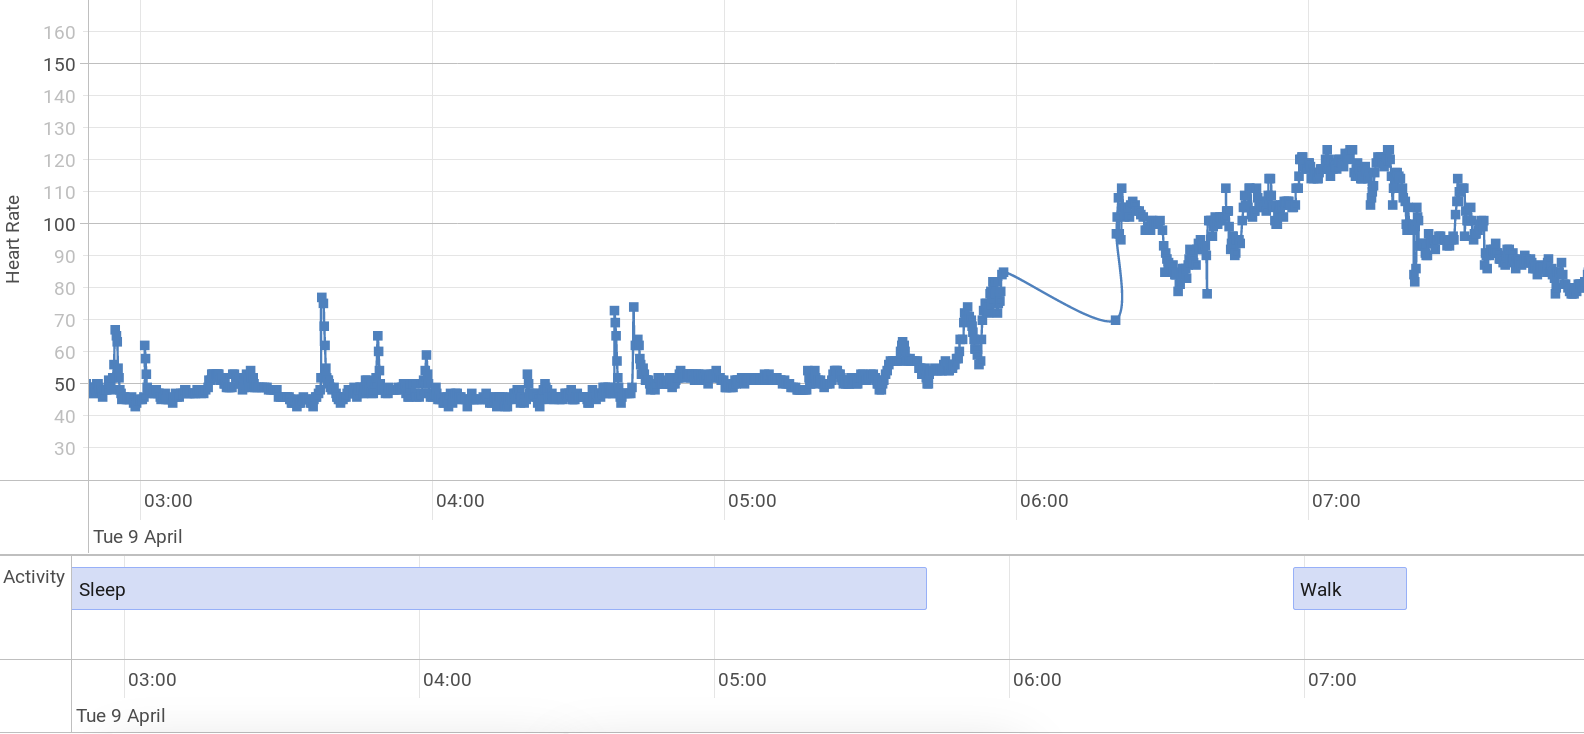
}It works! As an example, this is what my heart rate looks like over a week.

2.2 Time Line
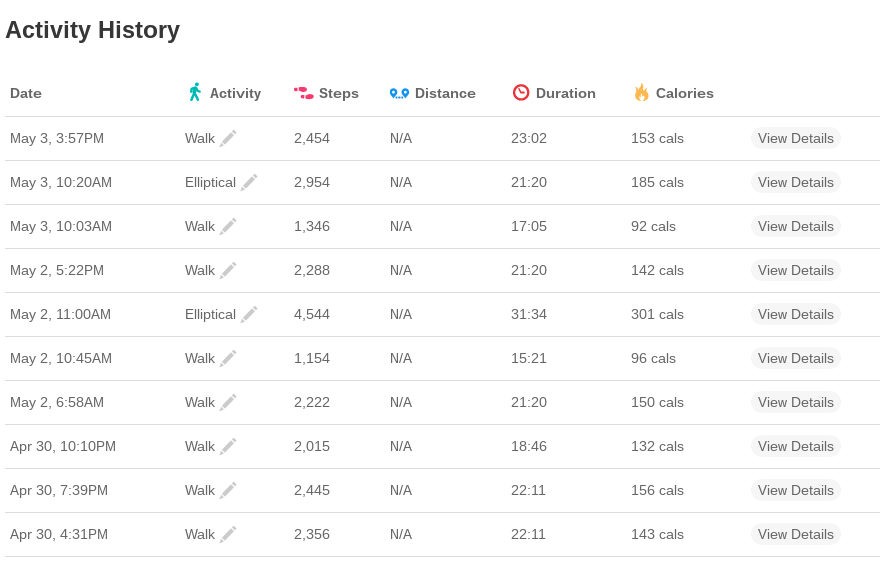
Fitbit does a pretty good job of detecting and recording health related activities. The two major things that Fitbit detects is sleep and workout activities. Although the app does a good job at informing you about these activities, the app is lacking a comprehensive timeline. Rather than provide a timeline for these activities, the app only displays a simple list.
The JSON filea for sleep store a ton of data! For the sake of the time line, I am only interested in the start and finish times. Unlike the heart rate data, this actually stores the time zone.
[{
  "logId" : 22128553286,
  "dateOfSleep" : "2019-04-28",
  "startTime" : "2019-04-27T23:09:00.000",
  "endTime" : "2019-04-28T07:33:30.000",
  "duration" : 30240000,
  "minutesToFallAsleep" : 0,
  "minutesAsleep" : 438,
  "minutesAwake" : 66,
  "minutesAfterWakeup" : 1,
  "timeInBed" : 504,
  "efficiency" : 86,
  "type" : "stages",
  "infoCode" : 0,
  "levels" : {
    "summary" : {
      "deep" : {
        "count" : 4,
        "minutes" : 103,
        "thirtyDayAvgMinutes" : 89
      },
      "wake" : {
        "count" : 33,
        "minutes" : 66,
        "thirtyDayAvgMinutes" : 65
      },
      "light" : {
        "count" : 24,
        "minutes" : 214,
        "thirtyDayAvgMinutes" : 221
      },
      "rem" : {
        "count" : 16,
        "minutes" : 121,
        "thirtyDayAvgMinutes" : 93
      }
    },
    "data" : [{
      "dateTime" : "2019-04-27T23:09:00.000",
      "level" : "wake",
      "seconds" : 30
    },{
      "dateTime" : "2019-04-27T23:09:30.000",
      "level" : "light",
      "seconds" : 900
    },
The JSON file for each activity stores a lot of information on heart rate during the exercise. Similar to the heart rate file, this date format does not take into account time zones. Grr! Rather than storing the finish time like the sleep JSON file, this keeps track of the total duration of the event in milliseconds.
[{
  "logId" : 21092332392,
  "activityName" : "Run",
  "activityTypeId" : 90009,
  "activityLevel" : [{
    "minutes" : 0,
    "name" : "sedentary"
  },{
    "minutes" : 0,
    "name" : "lightly"
  },{
    "minutes" : 1,
    "name" : "fairly"
  },{
    "minutes" : 30,
    "name" : "very"
  }],
  "averageHeartRate" : 149,
  "calories" : 306,
  "duration" : 1843000,
  "activeDuration" : 1843000,
  "steps" : 4510,
  "logType" : "auto_detected",
  "manualValuesSpecified" : {
    "calories" : false,
    "distance" : false,
    "steps" : false
  },
  "heartRateZones" : [{
    "name" : "Out of Range",
    "min" : 30,
    "max" : 100,
    "minutes" : 0
  },{
    "name" : "Fat Burn",
    "min" : 100,
    "max" : 140,
    "minutes" : 6
  },{
    "name" : "Cardio",
    "min" : 140,
    "max" : 170,
    "minutes" : 24
  },{
    "name" : "Peak",
    "min" : 170,
    "max" : 220,
    "minutes" : 1
  }],
  "lastModified" : "04/06/19 17:51:30",
  "startTime" : "04/06/19 17:11:48",
  "originalStartTime" : "04/06/19 17:11:48",
  "originalDuration" : 1843000,
  "hasGps" : false,
  "shouldFetchDetails" : false
}
After we import both the sleep files and activity files, we can use the VisJS library to construct a timeline.
function generateTimeline(jsonFiles)
{
    var items = [];

    for(var i = 0; i < jsonFiles.length; i++)
    {
        for(var j = 0; j < jsonFiles[i].length; j++)
        {
            if(jsonFiles[i][j].hasOwnProperty("dateOfSleep"))
            {
                var startT = new Date(jsonFiles[i][j].startTime);
                var finishT = new Date(jsonFiles[i][j].endTime);
                items.push({content: "Sleep",
                    start:startT, end:finishT, group:0});
            }
            else
            {
                var localTime = new Date(jsonFiles[i][j].startTime);
                var timeAdjusted = localTime.setHours(localTime.getHours() - 4);
                var timeFinish = localTime.setMilliseconds(
                    localTime.getMilliseconds() + jsonFiles[i][j].activeDuration);
                items.push({content: jsonFiles[i][j].activityName,
                    start:timeAdjusted, end:timeFinish, group:0});
            }
       }
    }
    console.log("Finished Loading Heart Rate Data Into Graph");

    var dataset = new vis.DataSet(items);
    var options =
    {
        margin:
            {
                item:20,
                axis:40
            },
        showCurrentTime: false
    };

    var grpups = new vis.DataSet([
        {id: 0, content:"Activity", value:0}
    ]);

    var container = document.getElementById("heartRateGraph");
    var graph2d = new vis.Timeline(container, dataset, options);
    graph2d.setGroups(grpups);
    graph2d.on('rangechanged', graphMoved);
    graphsOnPage.push(graph2d);
}
To make both the heart rate graph and the activity timeline focused on the same region at the same time, I used the ‘rangechanged’ event to move the other graphs’s window of view.
function graphMoved(moveEvent)
{
graphsOnPage.forEach((g)=>
{
g.setWindow(moveEvent.start, moveEvent.end);
})
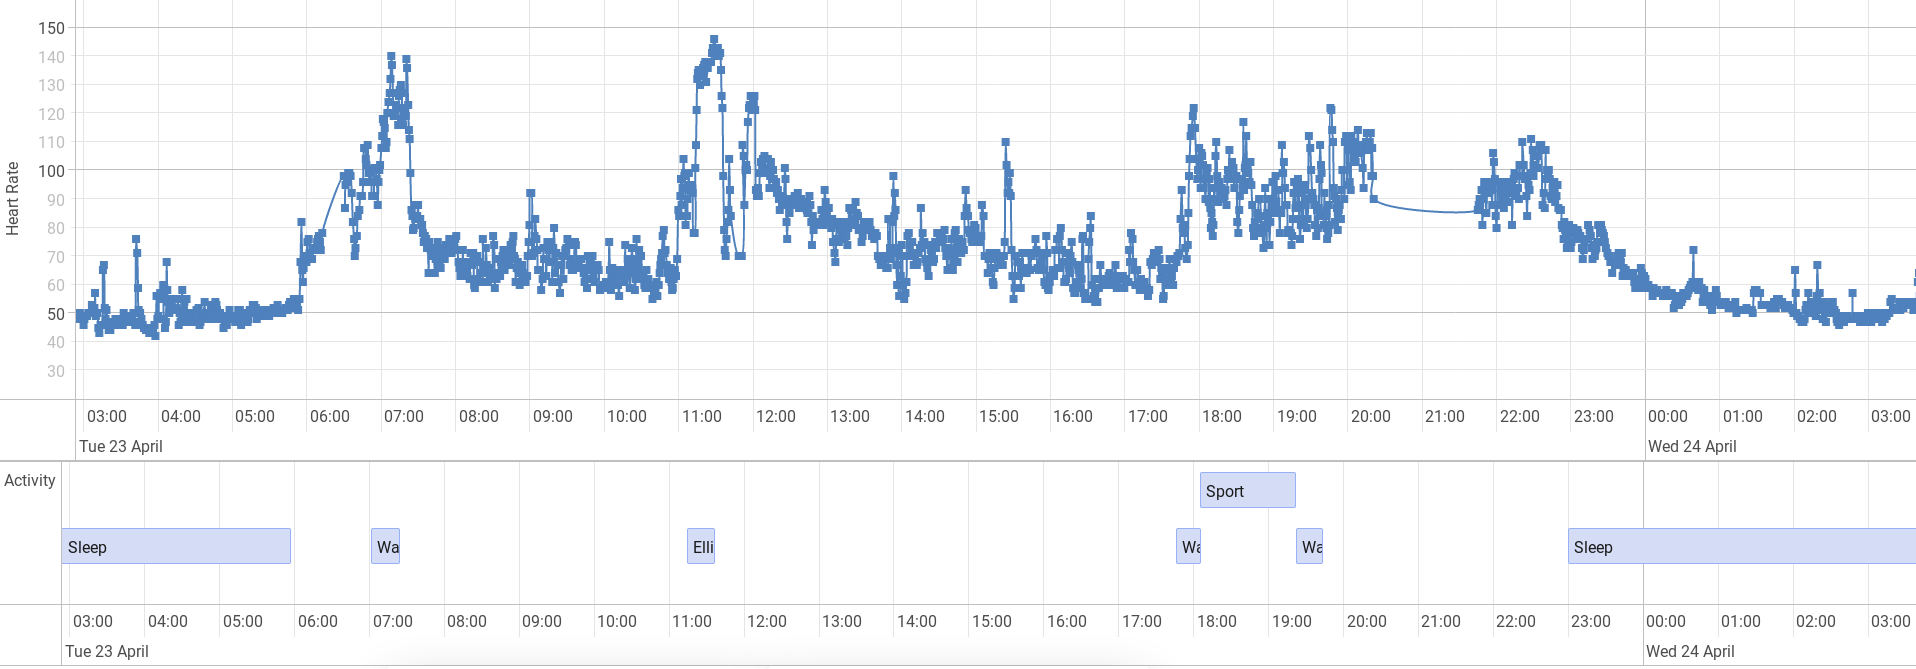
}I am pretty pleased with how these two graphs turned out. When you zoom too far out of the graph, the events get really small, but, it does a pretty good job at visualizing a few days worth of data at a time.
3 Future Analysis
There is a ton of data to look at here and thousands of different angles which I can take. Since this blog post is getting rather long, I’m going to split this up and write a few more articles on Fitbit data. I currently have three ideas for future blog posts on this topic.
- What factors affect sleep quality the most.
- Using fuzzy logic with Fitbit data to plan, train, and assess fitness goals.
- Third party data to use with Fitbit.
The full source code to the web page that I created today can be found on my Github.
Recent Posts
Server Monitoring and Restart Using a Raspberry PiMy Wall Mounted Raspberry Pi Homelab
The Data Spotify Collected On Me Over Ten Years
Visualizing Fitbit GPS Data
Running a Minecraft Server With Docker
DIY Video Hosting Server
Running Scala Code in Docker
Quadtree Animations with Matplotlib
2020 in Review
Segmenting Images With Quadtrees