Implementing a Quadtree in Python
Sat Oct 10 2020
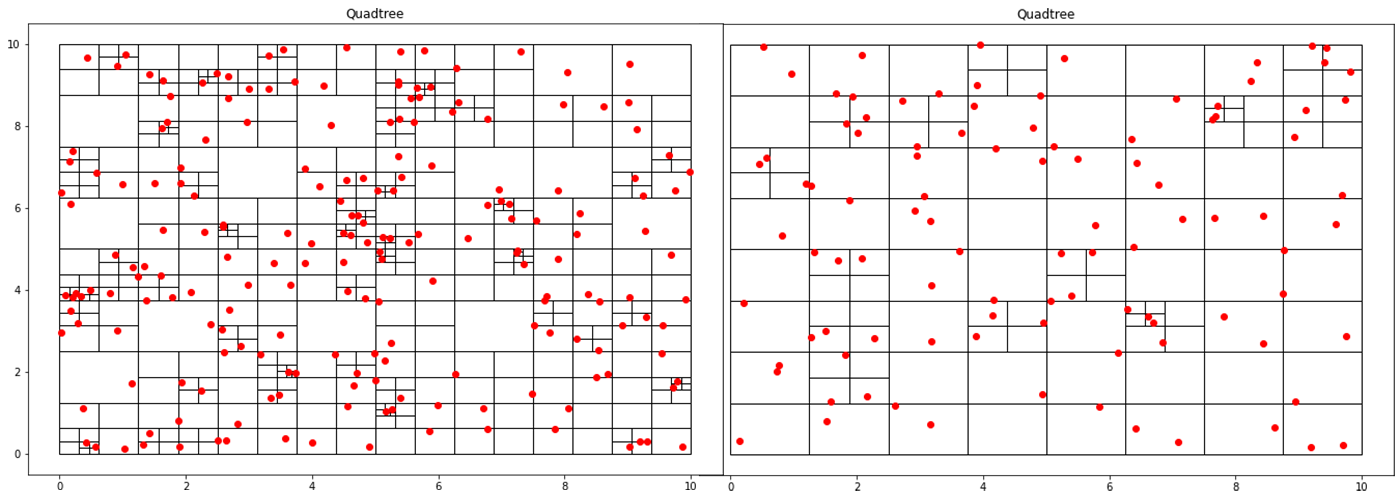
This blog post is the first part of a multi-post series on using quadtrees in Python. This post goes over quadtrees’ basics and how you can implement a basic point quadtree in Python. Future posts aim to apply quadtrees in image segmentation and analysis.
A quadtree is a data structure where each node has exactly four children. This property makes it particularly suitable for spatial searching. Quadtrees are generalized as “k-d/k-dimensional” trees when you have more than 4 divisions at each node. In a point-quadtree, leaf nodes are a single unit of spatial information. A quadtree is constructed by continuously dividing each node until each leaf node only has a single node inside of it. However, this partitioning can be modified so that each leaf node contains no more than K elements or that each cell can be at a maximum X large. This stopping criterion is similar to that of the stopping criteria when creating a decision tree.
Parallel Java Performance Overview
Fri Aug 07 2020
More cores = better performance, simple maths. Although it makes intuitive sense that more processing power would be advantageous, that is not always the case. There are multiple implementation paradigms and libraries for making a program run parallel; you have parallel streams, threads, and thread pools. However, there is no clear cut winner because many factors affect parallel program performance: the number of tasks, IO, amount of work in each task. This post aims to review the significant paradigms and factors affecting multi-threaded performance by looking at empirical data generated in Java. Additionally, topics like NQ and Amdahl’s law are examined within the context of the experiments presented.
1 Single Threaded
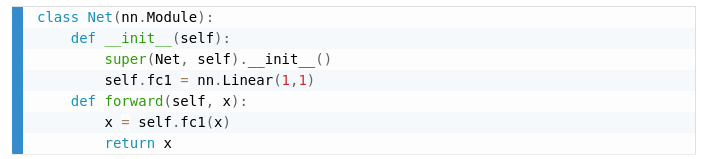
To gain ground for comparison, we establish a baseline task to get performed. We want to execute a list of tasks and store the results in a collection. On a single thread, this is merely a traversal with a mapping.
@Override
public List<E> runTasks(Vector<Work<E>> tasks)
{
    return tasks.stream()
        .map(Work::runTask)
        .collect(Collectors.toList());
}
Pandoc Syntax Highlighting With Prism
Sat Aug 01 2020
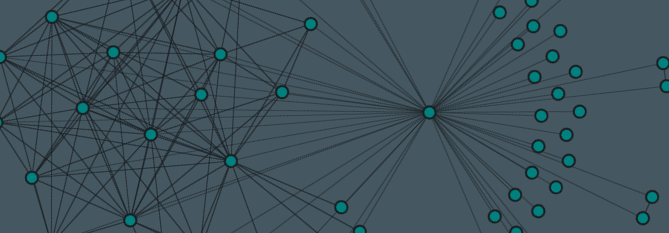
My blog uses Pandoc to convert markdown into HTML documents. However, the code highlighting that Pandoc does is dull.
The image below is what a Pandoc code block looked like:

Node2vec With Steam Data
Sun Jul 26 2020
Graph algorithms!!! Working with graphs can be a great deal of fun, but sometimes we just want some cold hard vectors to do some good old-fashioned machine learning. This post looks at the famous node2vec algorithm used to quantize graph data. The example I’m giving in this blog post uses data from my recently resurrected steam graph project.
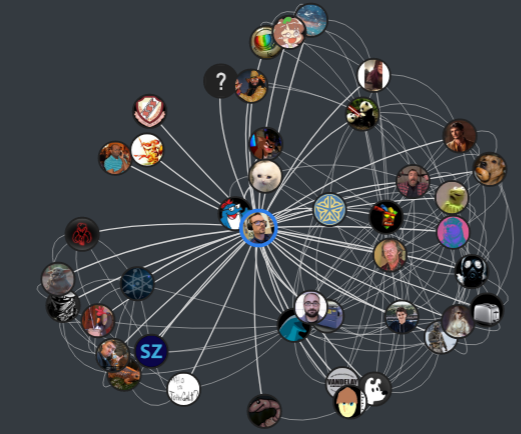
If you live under a rock, Steam is a platform where users can purchase, manage, and play games with friends. Although there is a ton of data within the Steam network, I am only interested in the graphs formed connecting users, friends, and games. My updated visualization to show a friendship network looks like this:
Creating a Dynamic Github Profile
Sat Jul 25 2020
Over the last few weeks, Github has been making changes to its UI. I’m the most excited about the feature that enables you to “design” your profile using a readme file. This reminds me of Myspace, where everyone had creative freedom to customize their profiles. Github being a platform for developers, people are already finding innovative ways to utilize this feature.
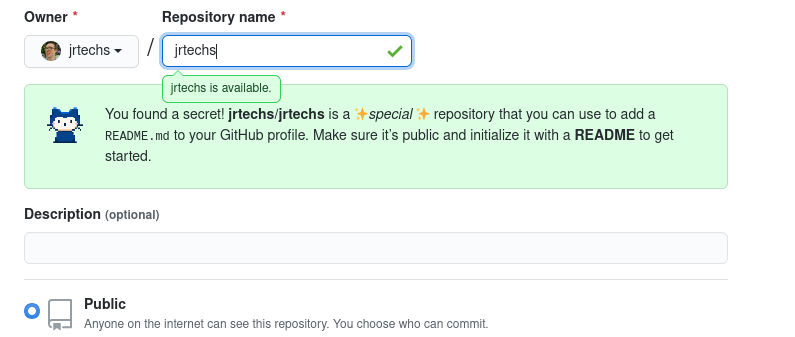
To create one of these readme profiles, you just need to create a repository with the same name as your account, and the content you put in the base readme file will appear over your pinned repositories on your account.
Recent Posts
Server Monitoring and Restart Using a Raspberry PiMy Wall Mounted Raspberry Pi Homelab
The Data Spotify Collected On Me Over Ten Years
Visualizing Fitbit GPS Data
Running a Minecraft Server With Docker
DIY Video Hosting Server
Running Scala Code in Docker
Quadtree Animations with Matplotlib
2020 in Review
Segmenting Images With Quadtrees